Freight Class Calculator

Freight Class Chart

Current 13-Tier LTL Scale

Freight Class Chart — Current 13-Tier Density Scale

Use this freight class chart to compare packaged shipment density with estimated LTL freight classes across the current 13-tier scale.

  • 13 current density tiers: Classes 400 through 50.
  • Current scale effective July 19, 2025: use the current density-based LTL reference.
  • Measure the finished package: include pallets, packaging, projections, overhang, and total packaged weight.
  • Density provides an estimated class: handling, stowability, liability, and applicable provisions may also affect final classification.

LTL Freight Class & Density Chart

PNG PDF

Calculate Freight Density & Estimated Class

How to use
Multiple sizes or weights? Use the Freight Density Calculator.

Measurement Units

Applies to the shipment dimensions and weight below.

Example Density & Class Result

Estimated Class

Density range: 8 to less than 10 lb/cu ft

100

Density

Packaged shipment density

9.38lb/cu ft

Total Cubic Feet

Total packaged volume

53.33cu ft

See the Next Density Breakpoint

Weight at next tier

Cube at next tier

Planning comparison only. Always enter the shipment’s actual tendered weight and greatest outside dimensions.

See the Density Calculation

Match Your Density to an Estimated Freight Class

Your calculated density is highlighted automatically in the table below. Already know your packaged density? Find the range containing that value, then read across to the estimated class and possible packaged examples.

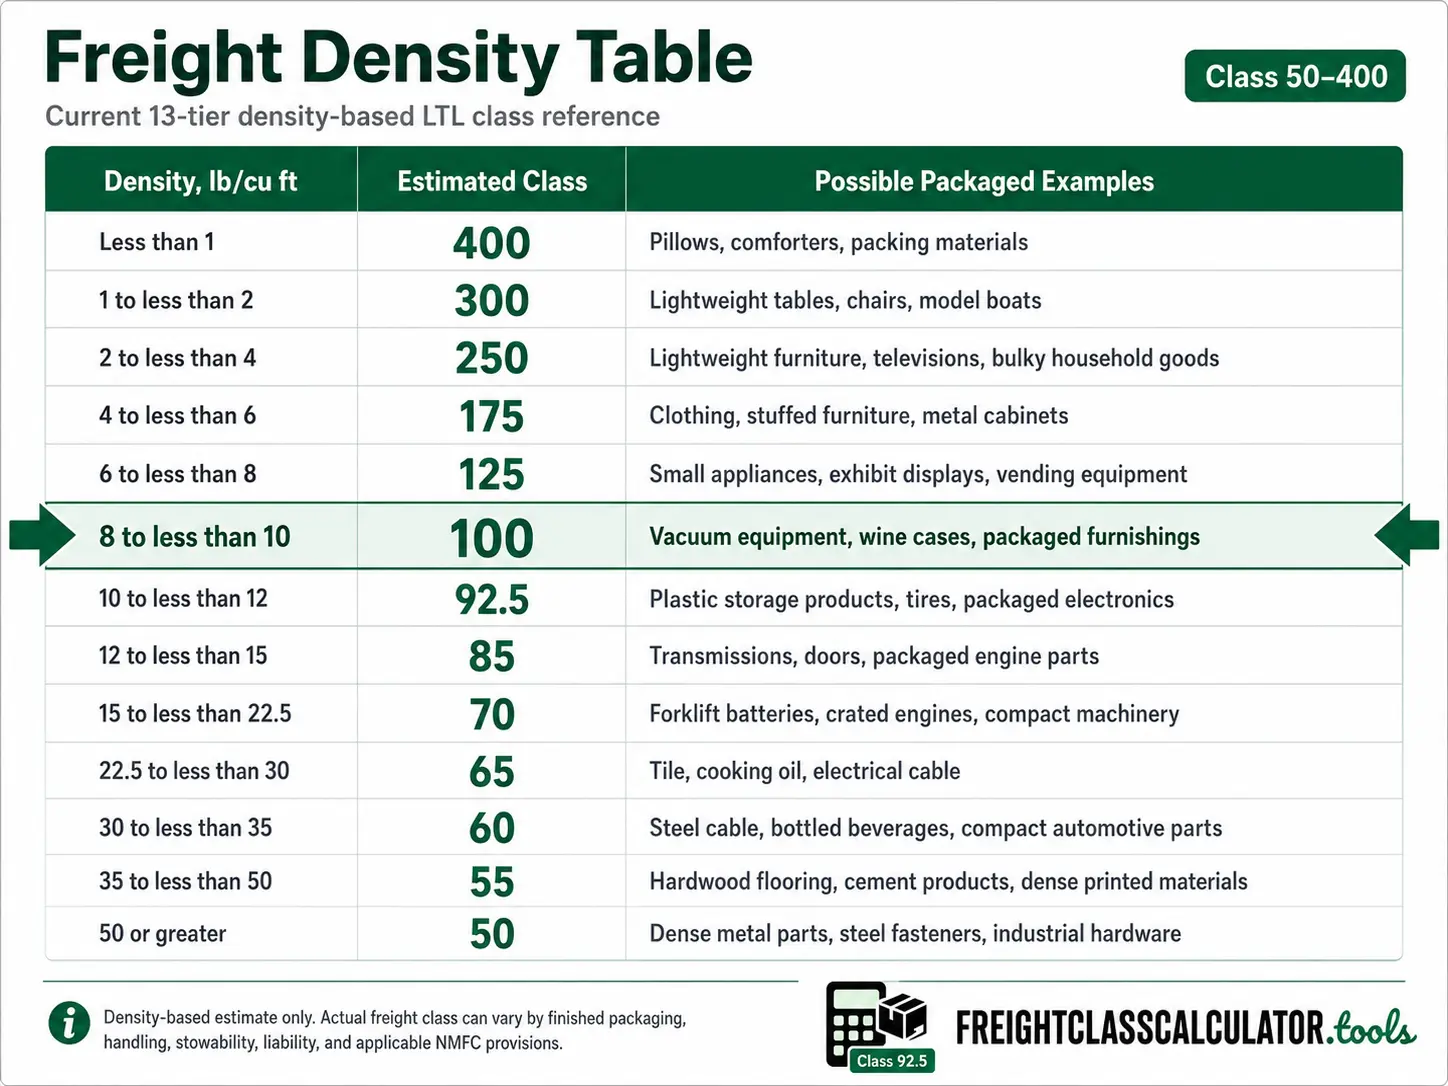
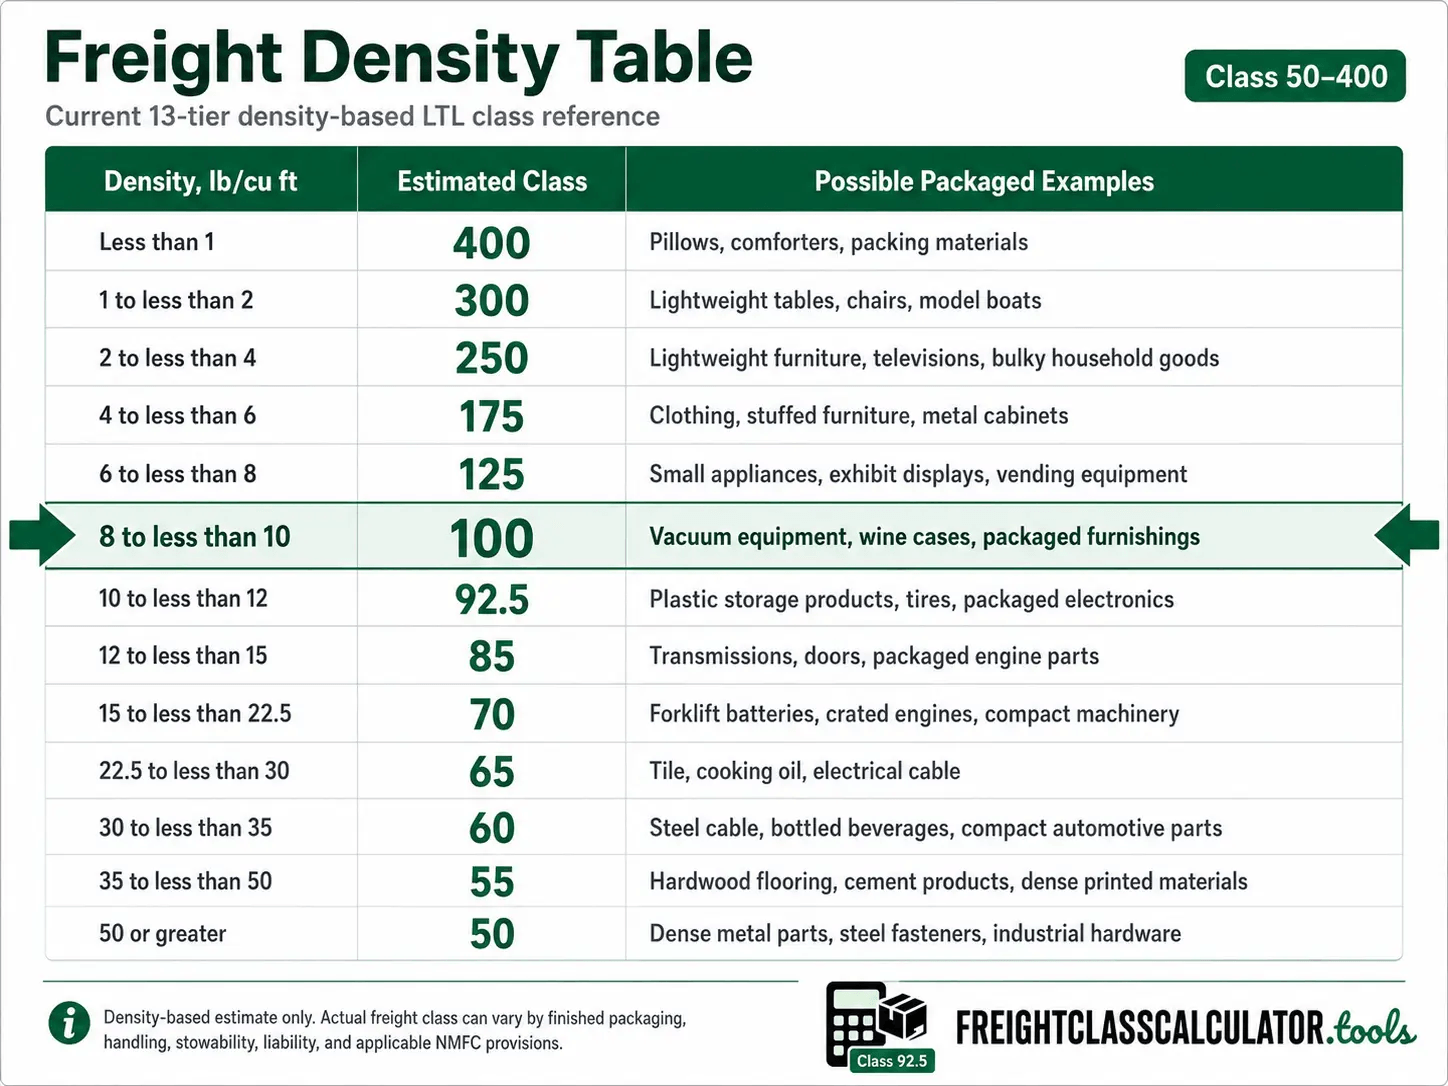
Freight density chart showing pounds per cubic foot ranges, estimated freight classes, possible packaged examples, and available freight class guides.
Density, lb/cu ft Estimated Class Possible Packaged Examples Class Guide
Breakpoint Rule: Tier ranges include the lower limit and exclude the upper limit. Example: 8.00 PCF → Class 100; 7.99 PCF → Class 125
Less than 1 400 Pillows, comforters, packing materials Freight Class 400
1 to less than 2 300 Lightweight tables, chairs, model boats Freight Class 300
2 to less than 4 250 Lightweight furniture, televisions, bulky household goods Freight Class 250
4 to less than 6 175 Clothing, stuffed furniture, metal cabinets Freight Class 175
6 to less than 8 125 Small appliances, exhibit displays, vending equipment Freight Class 125
8 to less than 10 100 Vacuum equipment, wine cases, packaged furnishings Freight Class 100
10 to less than 12 92.5 Plastic storage products, tires, packaged electronics Freight Class 92.5
12 to less than 15 85 Transmissions, doors, packaged engine parts Freight Class 85
15 to less than 22.5 70 Forklift batteries, crated engines, compact machinery Freight Class 70
22.5 to less than 30 65 Tile, cooking oil, electrical cable Freight Class 65
30 to less than 35 60 Steel cable, bottled beverages, compact automotive parts Freight Class 60
35 to less than 50 55 Hardwood flooring, cement products, dense printed materials Freight Class 55
50 or greater 50 Dense metal parts, steel fasteners, industrial hardware Freight Class 50

Example: Find the Matching Density Range

A 48 × 40 × 42 inch shipment weighing 900 lb occupies 46.67 cubic feet and has a density of 19.29 lb/ft³. That falls in the 15 to under 22.5 lb/ft³ range, which maps to an estimated Class 70.

Exact breakpoint: use the row beginning at that value. For example, 10.00 PCF belongs in the 10 to less than 12 PCF range.

Off-scale class note

Classes such as 77.5, 110, 200, and 500 may appear in NMFC or carrier classification contexts but are not part of this density-based chart.

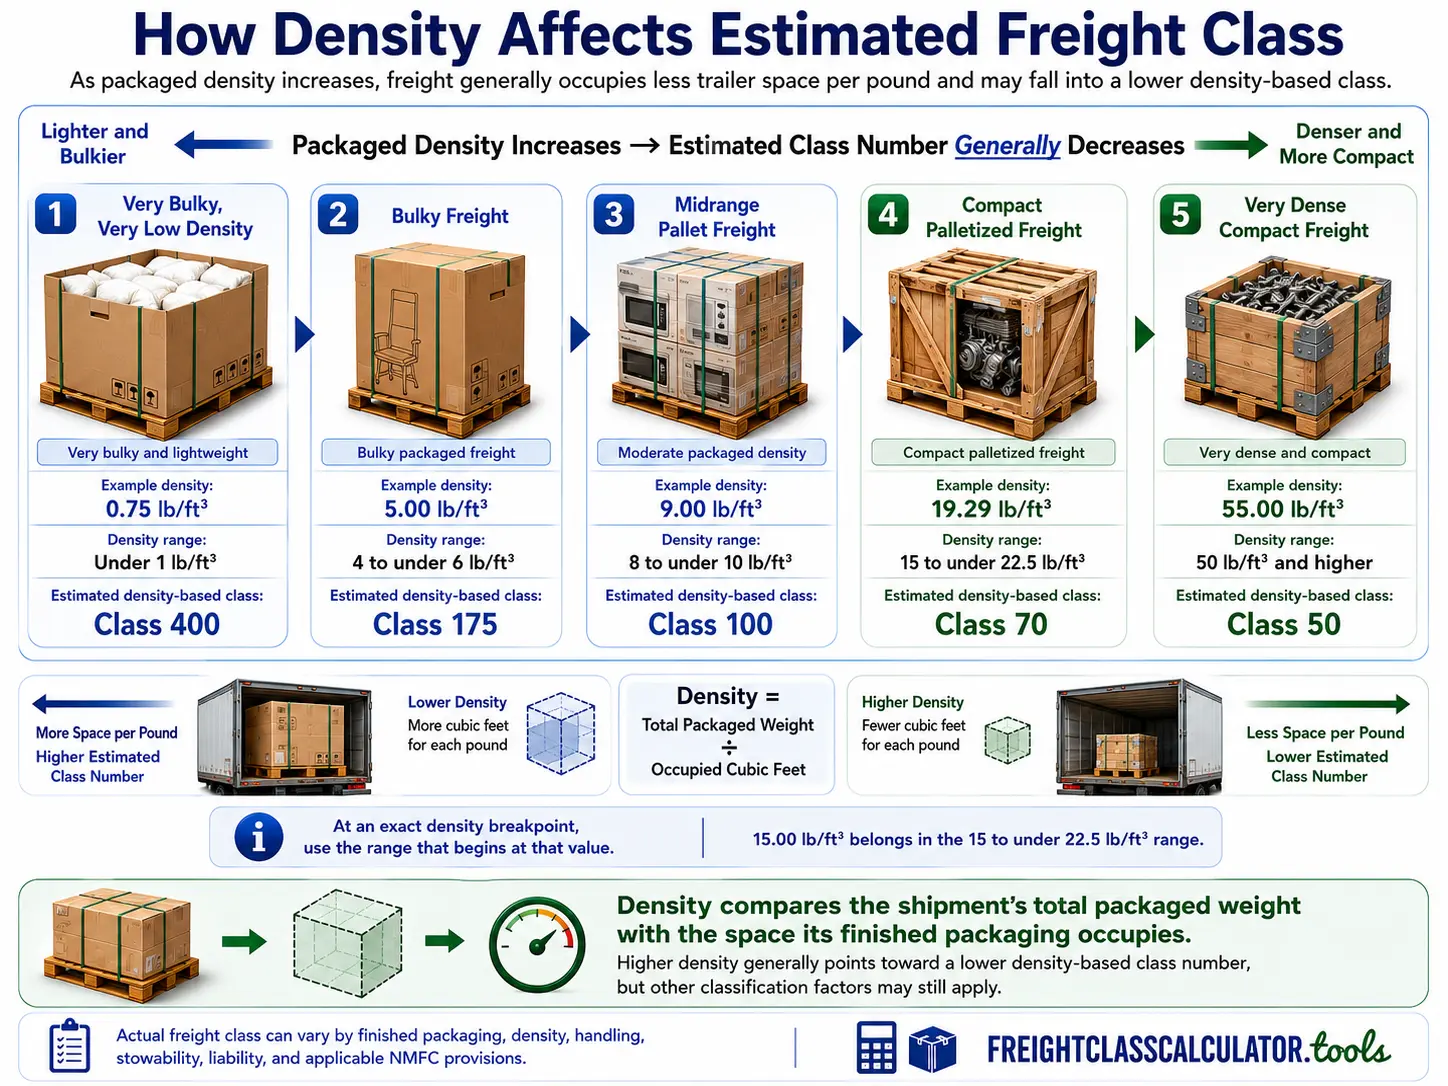
How Density Affects Estimated Freight Class

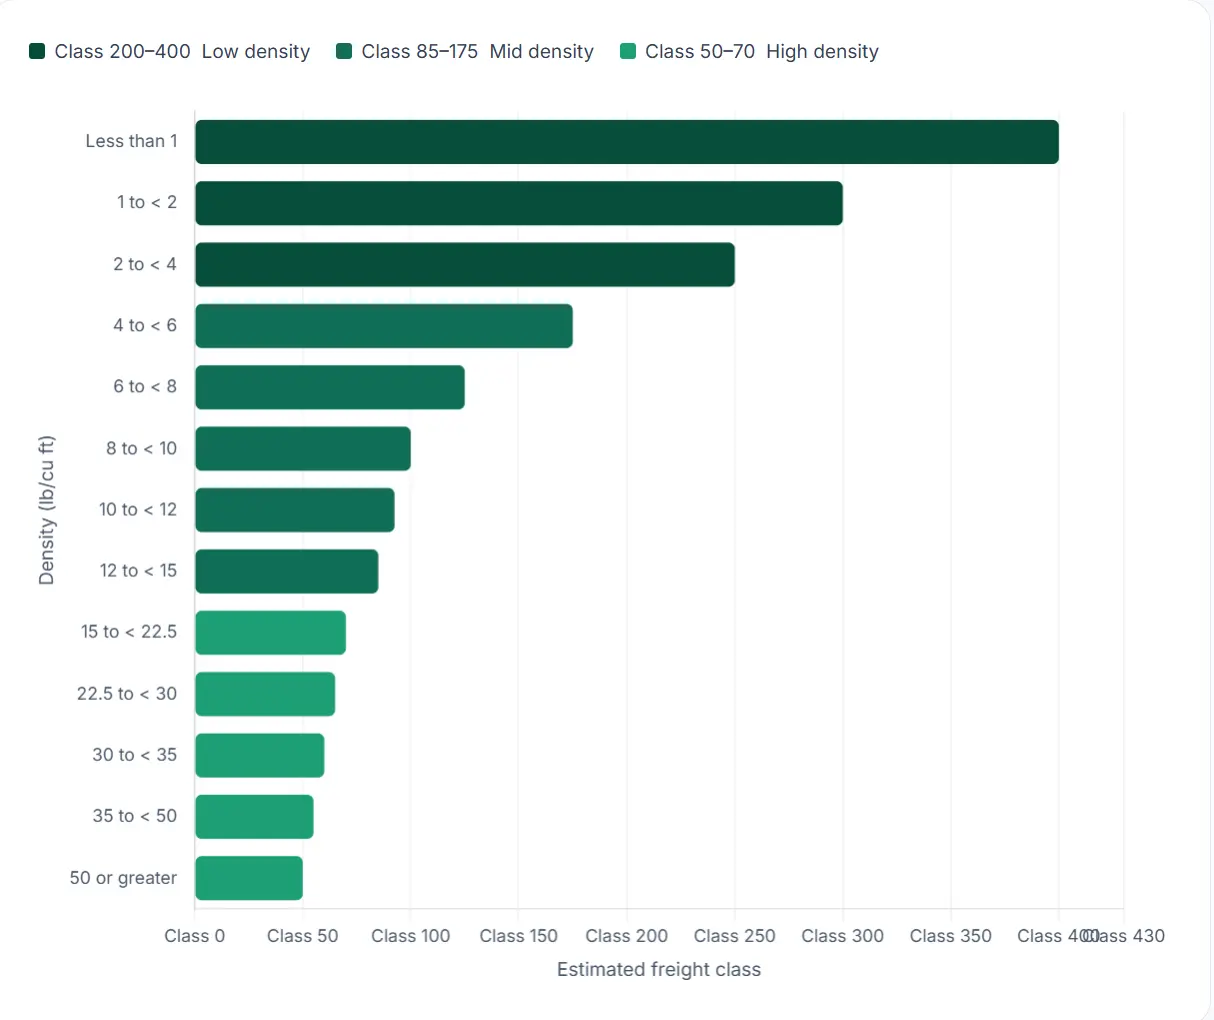
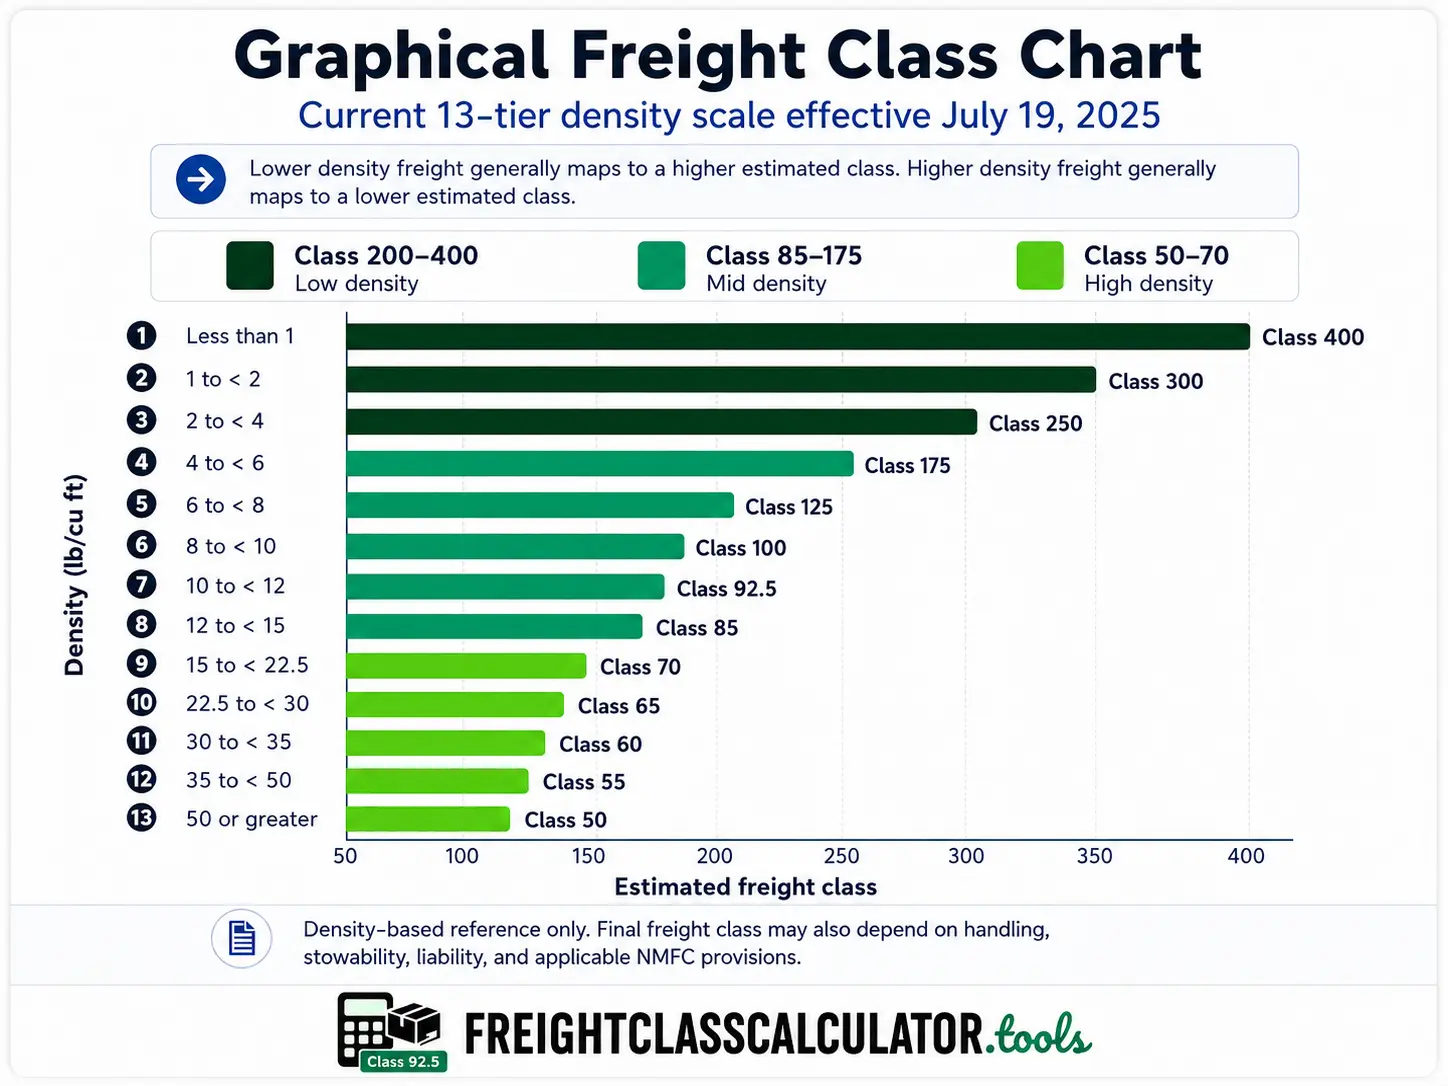
Within this density-based scale, lighter and bulkier freight generally maps to a higher class number, while denser freight generally maps to a lower class number. The relationship applies to the packaged shipment—not the unpackaged product.

How freight density affects estimated freight class, showing packaged density increasing from 0.75 to 55 lb/ft³ while estimated density-based class decreases from Class 400 to Class 50. Click for full size

Why Final Freight Class May Differ From the Density Estimate

This chart produces a density-based planning estimate. The applicable NMFC item and other transportation characteristics may lead to a different final classification.

Why final freight class may differ from a density estimate, showing density, handling, stowability, liability and commodity-specific classification factors around an estimated Class 70 shipment. Click for full size

How to Measure Palletized Freight

Use the greatest straight-line outside length, width, and height of each handling unit as tendered. Include pallets, crates, wrap, projections, bulges, and overhang. For pallet-specific planning, use the Pallet Freight Class Calculator.

How to measure a pallet for freight density using the longest, widest and tallest finished outside points, including the pallet, packaging, overhang and projections. Click for full size

Common Freight Measurement Mistakes to Avoid

Measure the finished handling unit rather than the product alone. Include pallet height, overhang, protective packaging, and projections; use actual shipment weight; calculate separately handled units separately; and do not round dimensions down.

Common freight measurement mistakes shown with incorrect and correct examples, including product-only dimensions, missing pallet height, ignored overhang, estimated weight, combined handling units and rounding down. Click for full size

How Packaging Changes Freight Density and Class

These examples show how the same weight can map to a different density tier when the actual packaged dimensions change.

Same 900-pound shipment shown in compact, taller and oversized packaging, demonstrating how greater occupied cubic feet lowers freight density and may increase the estimated class number. Click for full size

Reduced Pallet Height

The same 300 lb shipment occupies less vertical space.

Before

48 × 40 × 36 in · 7.50 PCF · Class 125

4 inches lower

After

48 × 40 × 32 in · 8.44 PCF · Class 100

Removed Pallet Overhang

A smaller outside footprint raises density.

Before

52 × 44 × 40 in · 13.22 PCF · Class 85

Footprint reduced

After

48 × 40 × 40 in · 15.75 PCF · Class 70

Compact Crate Profile

Reducing crate height moves the shipment into a denser tier.

Before

60 × 48 × 48 in · 20.00 PCF · Class 70

8 inches lower

After

60 × 48 × 40 in · 24.00 PCF · Class 65

Examples use the shipment’s actual greatest outside dimensions after packaging. Select a button to load the after dimensions into the calculator.

How to Calculate Freight Density

Density Formula

Density (PCF) = Total Packaged Weight ÷ Total Cubic Feet

1 Multiply LENGTH × WIDTH × HEIGHT in inches.
2 Divide the cubic inches by 1,728 to convert the shipment volume to cubic feet.
3 Divide the total packaged weight by the total cubic feet.

One cubic foot contains 1,728 cubic inches.

How to calculate freight density using finished pallet dimensions, cubic feet and total packaged weight, with a 900-pound shipment calculating to 19.29 lb/ft³ and estimated Class 70. Click for full size

Printable Freight Class Charts

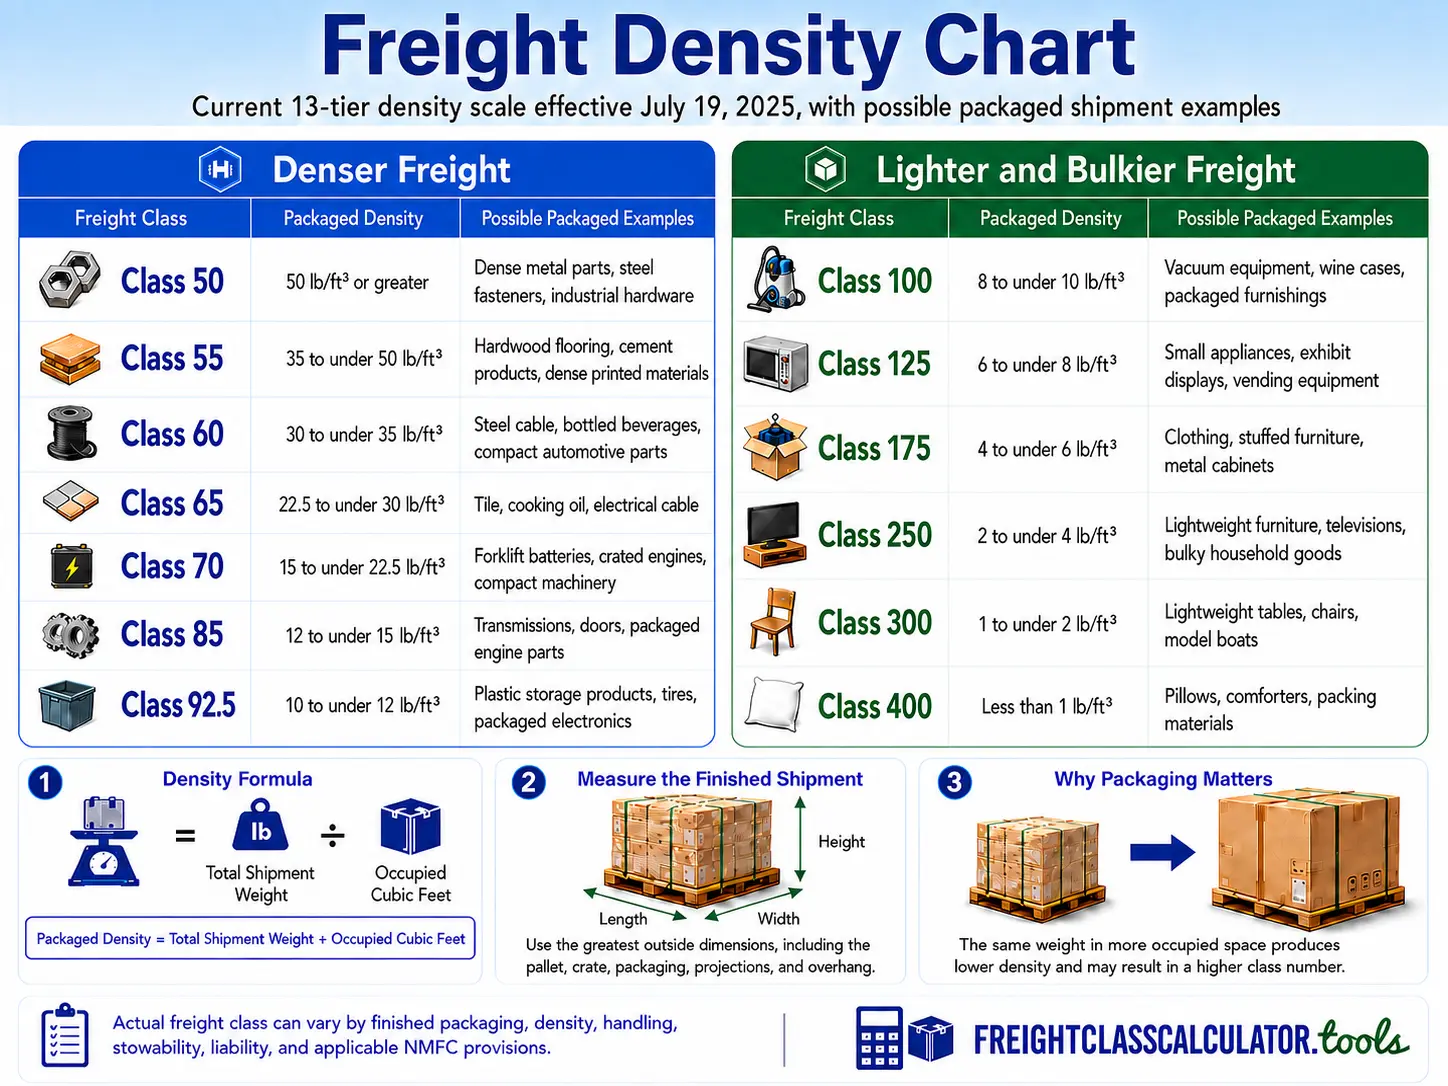
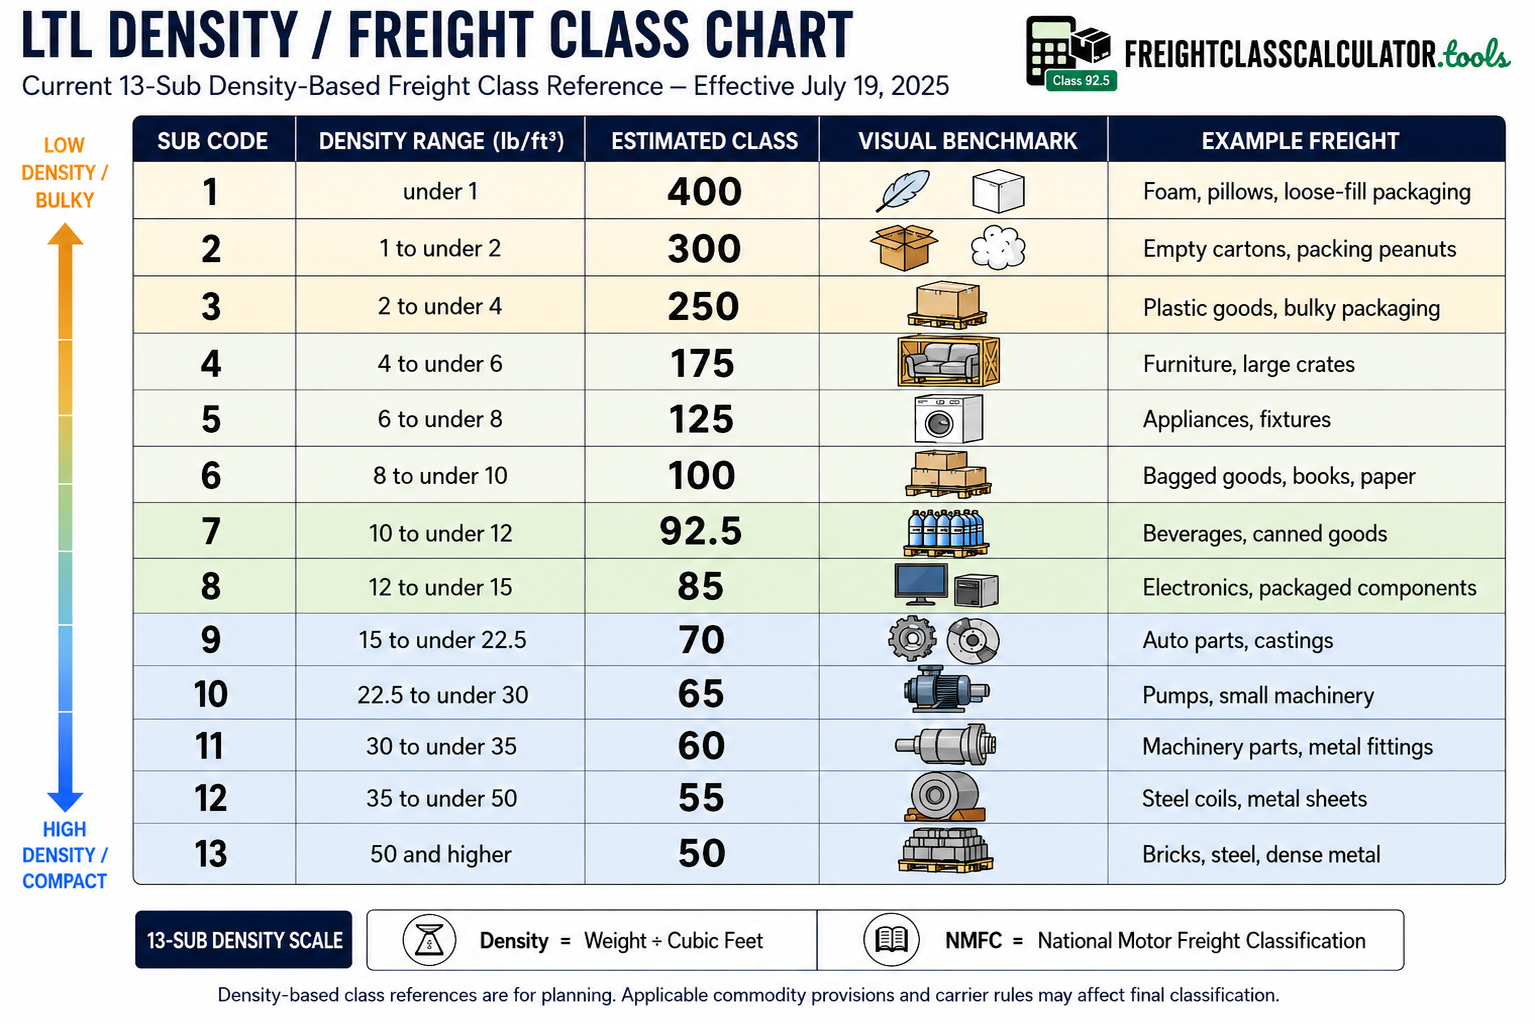
View, print, or download freight class and density charts using the current 13-tier density scale. Choose the format that works best for quick reference or shipment planning.

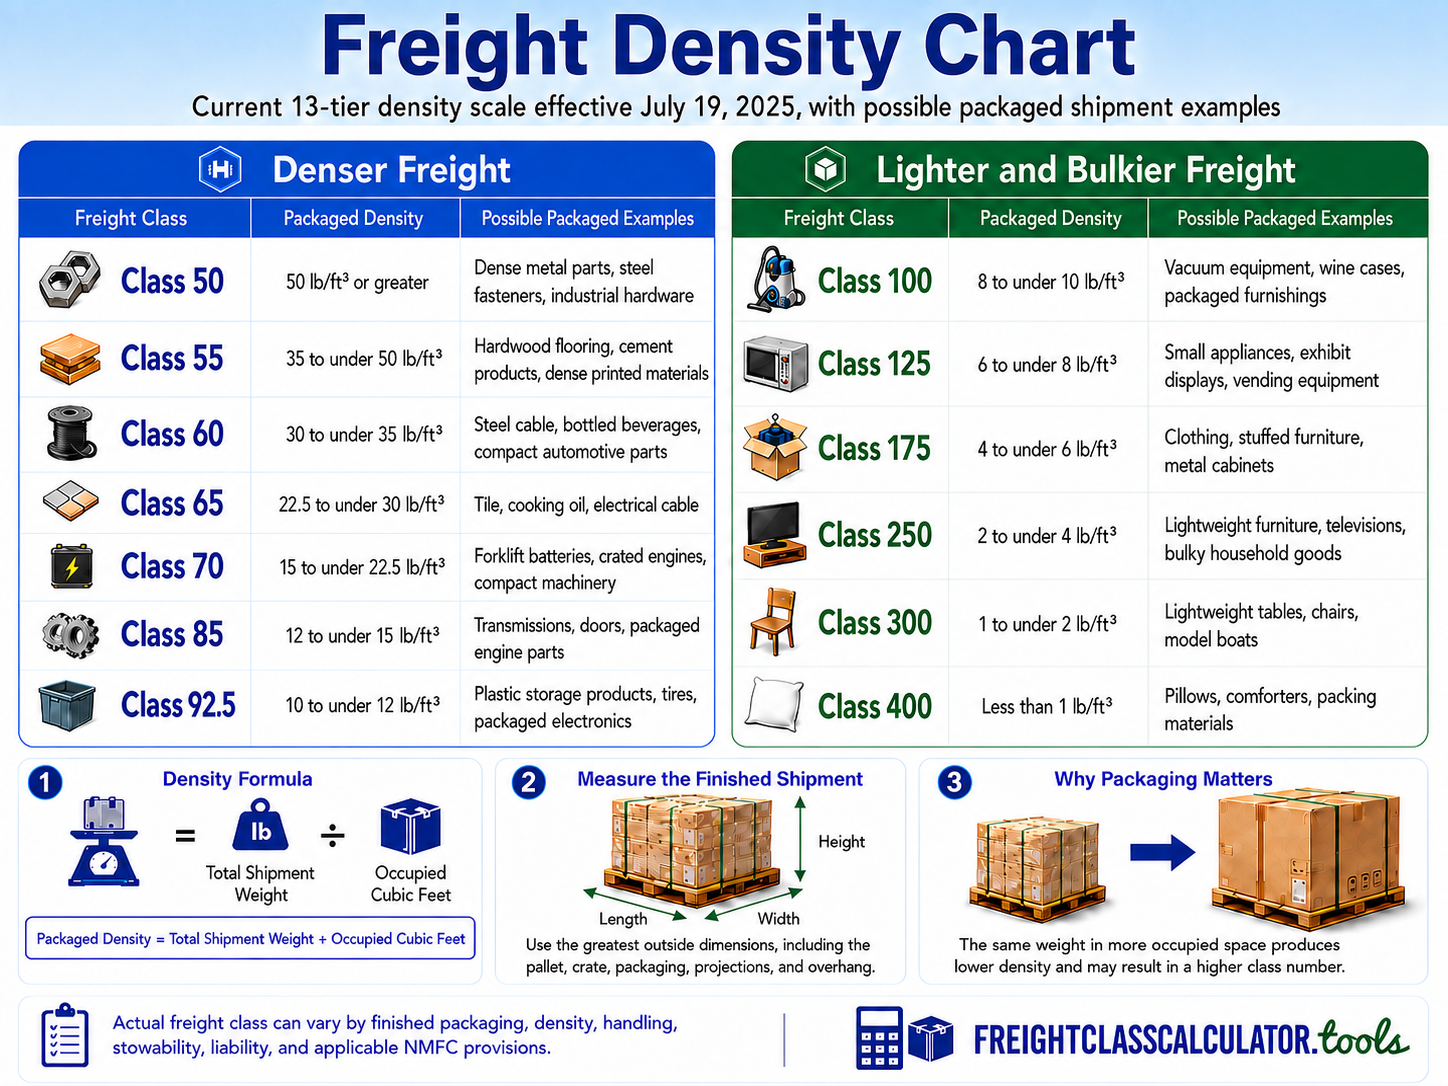
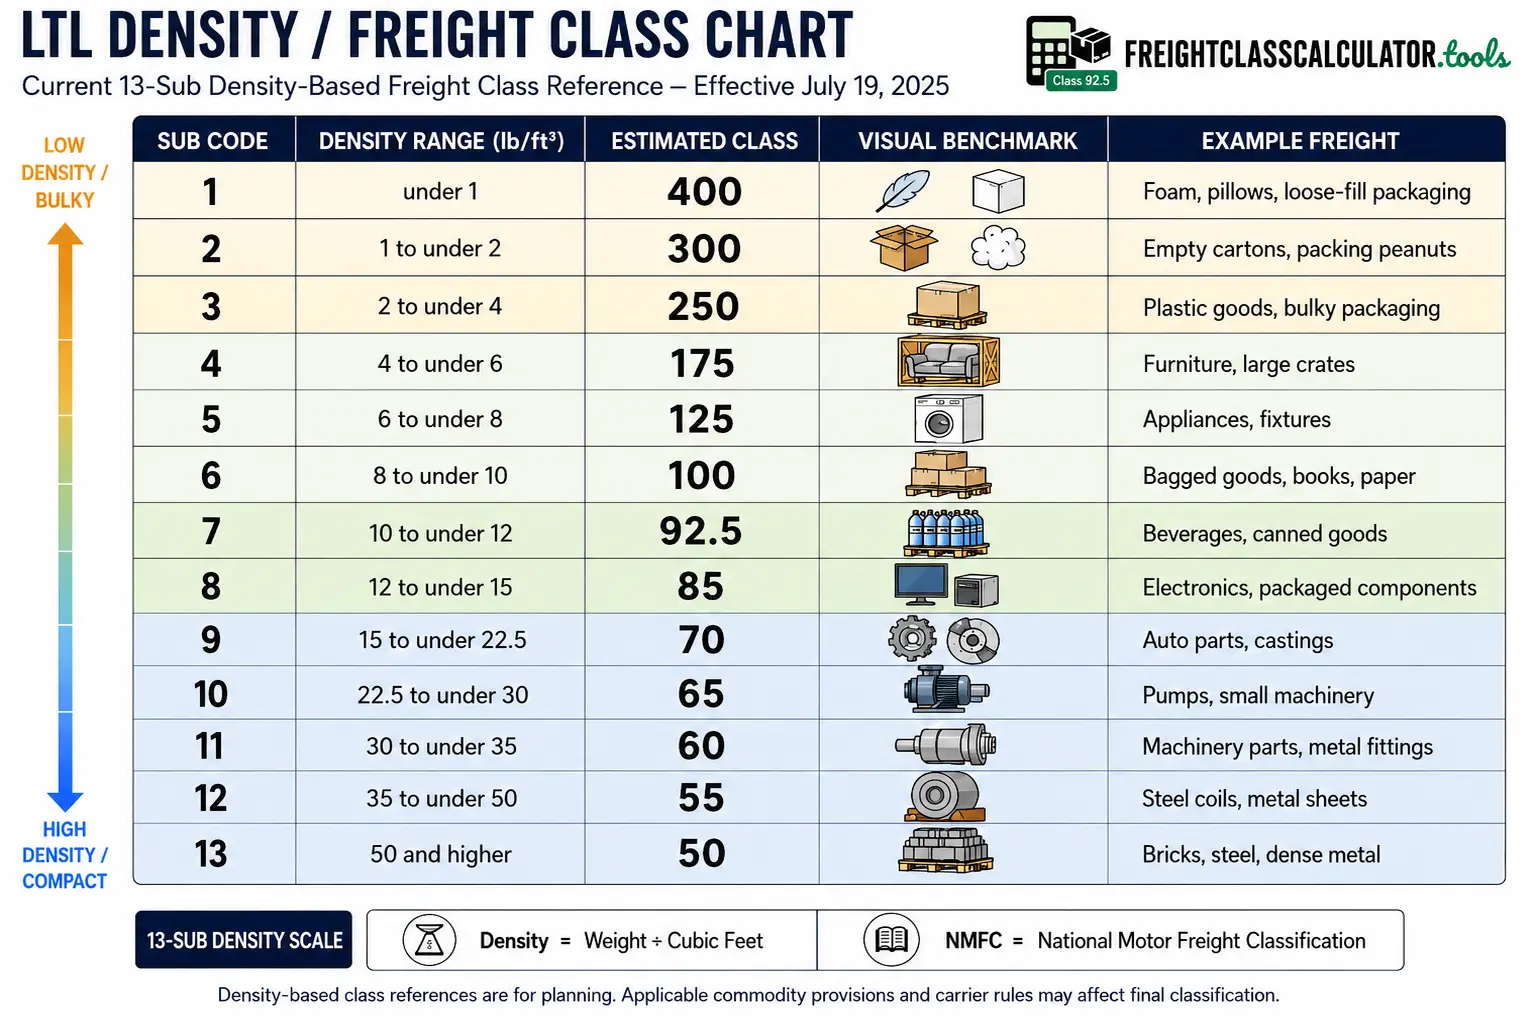
Freight density chart showing the current 13-tier LTL density scale with density ranges, estimated freight classes, shipment examples, and visual references.

13-Tier LTL Freight Density Chart

Review the current density scale with estimated classes, shipment examples, density formula, and measurement guidance.

Freight Density Chart FAQ

How do I use this freight density chart?

Enter the packaged dimensions and weight above, or find a known PCF value in the chart. The matching row shows the density-based estimated class.

Which range applies exactly at a breakpoint?

Use the tier whose lower limit matches the result. Exactly 10.00 PCF falls in the 10 to less than 12 PCF tier.

What should I check if my density is close to another class range?

Recheck the complete packaged dimensions and weight, including the pallet, wrap, crate, carton, and any overhang. Small measurement differences can move the result into a nearby range.

When should I use the Freight Density Calculator instead of this chart?

Use the Freight Density Calculator when you know the shipment dimensions and weight but do not yet know the pounds-per-cubic-foot value. Use this chart after the density has already been calculated.

Should pallet overhang be included?

Yes. Use the greatest outside dimensions of the complete handling unit, including packaging, projections, and overhang as tendered.

Does density always determine final freight class?

No. Density is central to this estimate, but handling, stowability, liability, and the applicable NMFC item can affect final classification.

Reference Scope

How This Freight Density Chart Was Built

This page provides a density-based freight class reference for planning estimates using the current 13-tier LTL density scale effective July 19, 2025. It does not reproduce the NMFC, provide an official item classification, quote carrier pricing, interpret tariffs, or replace review by a carrier, broker, NMFC resource, or ClassIT+.

Source scope reviewed: August 2026 Density-based estimate only
Sections