Measure the complete outside dimensions
Measure the packaged handling unit—not only the product or pallet deck.
Enter shipment dimensions and weight to calculate cubic feet, density, and an estimated density-based freight class. The matching chart row highlights automatically.
Calculate before you look up
Measure one packaged handling unit at its greatest outside dimensions, including the pallet, packaging, projections, and overhang.
Density result
Total cubic feet
53.33
Density (PCF)
9.38
Estimated class
100
How close is the next density breakpoint?
Weight at next tier
Cube at next tier
Planning comparison only. Always enter the shipment’s actual tendered weight and greatest outside dimensions.
Density reference
Use the calculator above or find a known density in pounds per cubic foot, then read across to the estimated density-based class. The 30, 35, and 50 PCF breakpoints are emphasized because they form the upper-density tiers of the 13-level scale effective July 19, 2025.
How to use this chart
Use this lookup after you know the shipment density in pounds per cubic foot.
1 Find Shipment Density
Use the calculator above or a known pounds-per-cubic-foot value.
2 Match the Density Range
Choose the row where the result is at or above the lower limit and below the upper limit.
3 Read the Estimated Class
Read the estimated density-based freight class shown in the same row.
| Density, lb/cu ft | Estimated Class | Breakpoint Note |
|---|---|---|
| Less than 1 | 400 | Very low-density tier. |
| 1 to less than 2 | 300 | Low-density tier. |
| 2 to less than 4 | 250 | Bulky, lighter freight. |
| 4 to less than 6 | 175 | Common bulky LTL range. |
| 6 to less than 8 | 125 | Mid-density range. |
| 8 to less than 10 | 100 | Next breakpoint: 10 PCF. |
| 10 to less than 12 | 92.5 | Next breakpoint: 12 PCF. |
| 12 to less than 15 | 85 | Next breakpoint: 15 PCF. |
| 15 to less than 22.5 | 70 | Next breakpoint: 22.5 PCF. |
| 22.5 to less than 30 | 65 | Next breakpoint: 30 PCF. |
| 30 to less than 35 | 60 | Key breakpoint tier: 30–35 PCF. |
| 35 to less than 50 | 55 | Key breakpoint tier: 35–50 PCF. |
| 50 or greater | 50 | Highest density-based tier. |
Off-scale class note
Classes such as 77.5, 110, 200, and 500 may appear in NMFC or carrier classification contexts but are not part of this density-based chart.
This chart provides a density-based estimate. Commodity-specific classification or special handling requirements may produce a different final class.
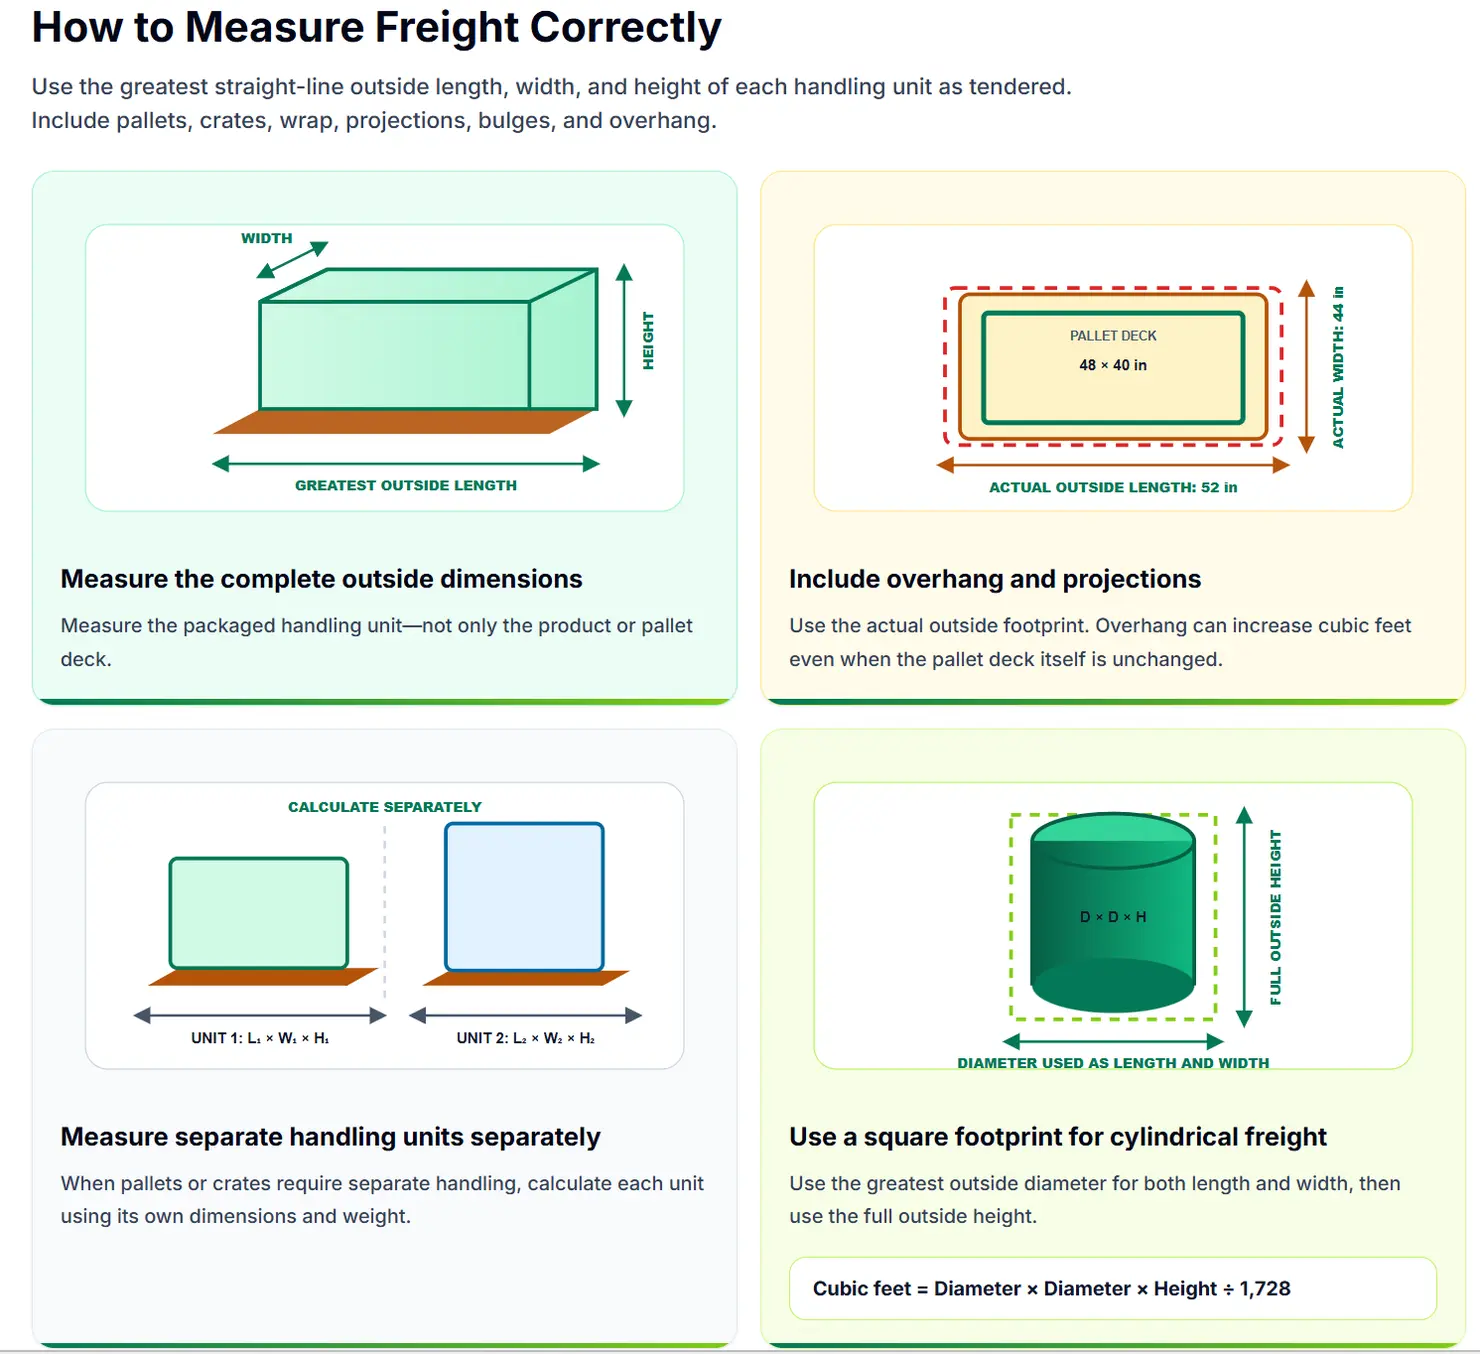
Measure the handling unit
Use the greatest straight-line outside length, width, and height of each handling unit as tendered. Include pallets, crates, wrap, projections, bulges, and overhang.
Measure the packaged handling unit—not only the product or pallet deck.
Use the actual outside footprint. Overhang can increase cubic feet even when the pallet deck itself is unchanged.
When pallets or crates require separate handling, calculate each unit using its own dimensions and weight.
Use the greatest outside diameter for both length and width, then use the full outside height.
Density is one factor
This chart produces a density-based planning estimate. The applicable NMFC item and other transportation characteristics may lead to a different final classification.
Weight relative to occupied cube determines the estimate shown in this chart.
Fragile, awkward, or special-handling freight may not follow the density-based estimate.
Irregular shapes, non-stackable freight, or space restrictions can affect classification.
Value, susceptibility to damage, theft exposure, or regulated characteristics may matter.
Packaging changes density
These examples show how the same weight can map to a different density tier when the actual packaged dimensions change.
Example 1
Before
48 × 40 × 36 in, 300 lb → 7.50 PCF → Class 125
After
48 × 40 × 32 in, 300 lb → 8.44 PCF → Class 100
Example 2
Before
52 × 44 × 40 in, 700 lb → 13.22 PCF → Class 85
After
48 × 40 × 40 in, 700 lb → 15.75 PCF → Class 70
Example 3
Before
60 × 48 × 48 in, 1,600 lb → 20.00 PCF → Class 70
After
60 × 48 × 40 in, 1,600 lb → 24.00 PCF → Class 65
Examples assume the displayed dimensions are the shipment’s actual greatest outside dimensions after packaging.
Calculation method
Multiply length × width × height in inches, divide by 1,728 to convert cubic inches to cubic feet, then divide total shipment weight by total cubic feet.
Density (PCF) = Total Weight ÷ Total Cubic Feet
1,728 is used because one cubic foot contains 12 × 12 × 12 = 1,728 cubic inches.
Field example
A shipment measuring 48 × 40 × 42 inches and weighing 900 lb has 46.67 cubic feet of volume and a density of 19.29 lb/cu ft.
Chart range used
19.29 lb/cu ft falls in the 15 to less than 22.5 lb/cu ft row.
Example result
Estimated density-based freight class: Class 70.
Source scope
This page provides a density-based freight class reference for planning estimates using the 13-level density-based LTL class scale effective July 19, 2025. It does not reproduce the NMFC, provide an official item classification, quote carrier pricing, interpret tariffs, or replace carrier, broker, NMFC, or ClassIT+ review.
Related freight tools
Use the next tool based on how your freight is packaged and how much detail you need.
Calculate multiple handling units and transfer shipment data into the class calculator.
Freight Density CalculatorEstimate density and class for one or more identical palletized handling units.
Pallet Freight Class CalculatorBrowse commodity-specific shipment formats, packaging notes, and density examples.
Browse all guidesOptional references
Open standalone image versions of the freight density chart and freight measurement guide.
Common questions
Enter the packaged dimensions and weight above, or find a known PCF value in the chart. The matching row shows the density-based estimated class.
Use the tier whose lower limit matches the result. Exactly 10.00 PCF falls in the 10 to less than 12 PCF tier.
Recheck the complete packaged dimensions and weight, including the pallet, wrap, crate, carton, and any overhang. Small measurement differences can move the result into a nearby range.
Use the Freight Density Calculator when you know the shipment dimensions and weight but do not yet know the pounds-per-cubic-foot value. Use this chart after the density has already been calculated.
Yes. Use the greatest outside dimensions of the complete handling unit, including packaging, projections, and overhang as tendered.
No. Density is central to this estimate, but handling, stowability, liability, and the applicable NMFC item can affect final classification.
Calculate your actual shipment
Use the full Freight Density Calculator for multiple items, transferred shipment data, and a detailed density result.
Freight Density Calculator →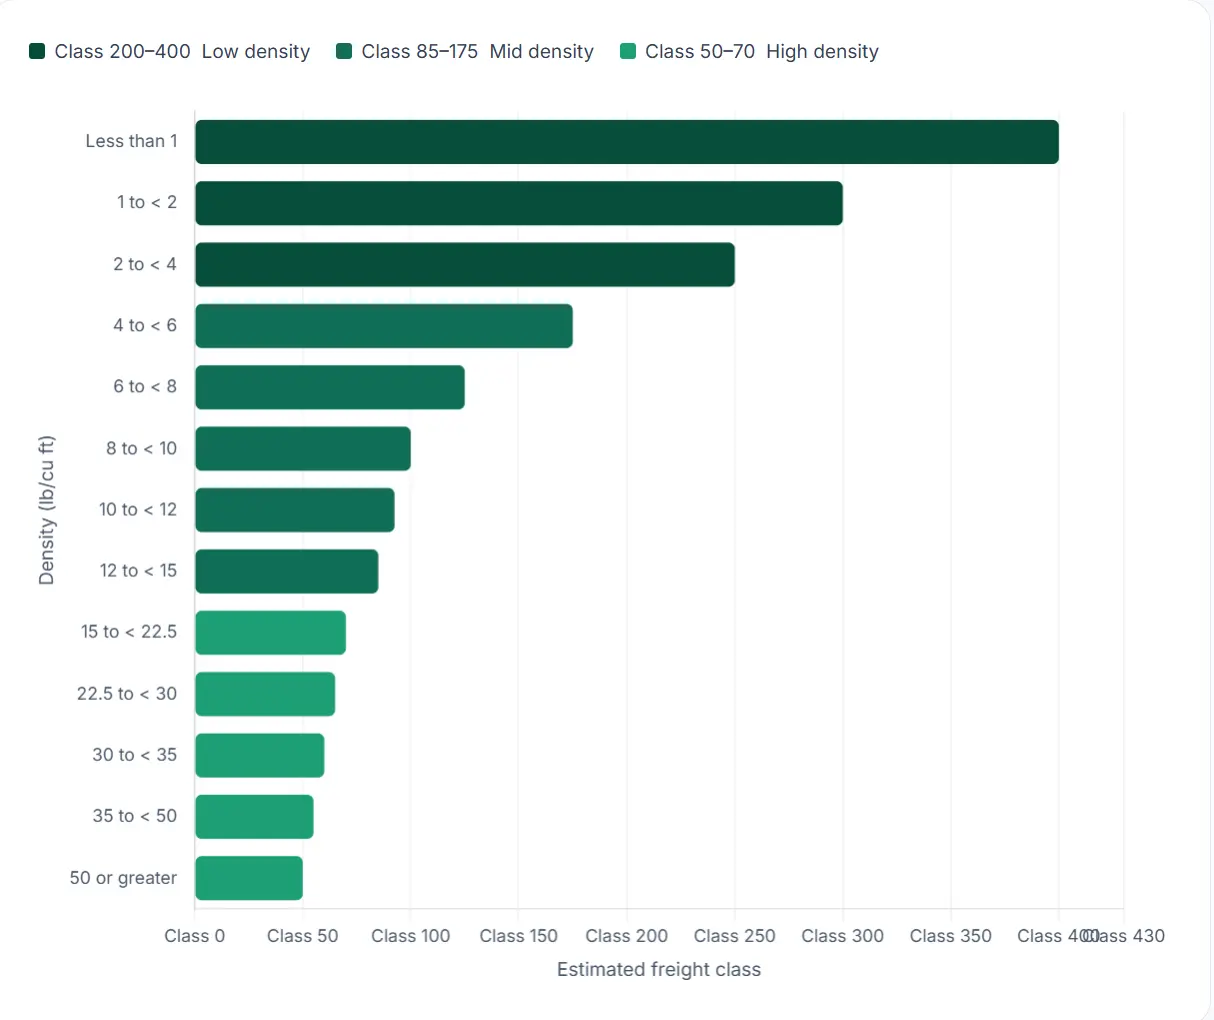